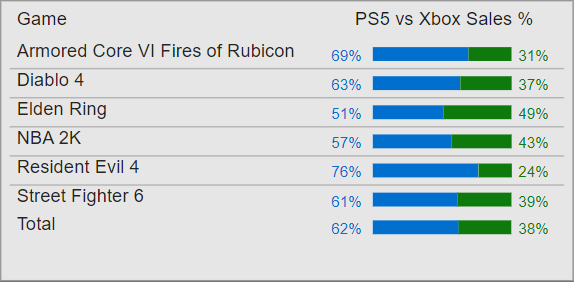
SVG Stacked Bar Comparing 2 Values

You can use the DAX code below to create a measure showcasing two values that total a 100%. Below is an example of comparing sales on each video games split out by Xbox and Playstation.
Source code
                SVG PS5 vs Xbox Sales % Stacked Bar =
// Adam Campbell / wwww.adamcampbell.tech
// Make sure measure is set to Data Type = Text
// Set Data category = Imague URL
// Can only be used in a table or matrix visual
// Doesn't work with negative values
// Under Format Pane set image size to same size as SVG Canvas

/* Get the 2 % values you wish to compare --------------------------------------*/
// Get Bar 1 and 2 Values based on % Sales vs Total Sales
VAR Bar1 = [PS5 Sales %]
VAR Bar2 = [Xbox Sales %]

/* Format Bar 1 and Label 2 ----------------------------------------------------*/
// Bar 1 (If 1 Then make a 100%)
VAR FormatBar1 = IF (
                             SUBSTITUTE(FORMAT(Bar1, "0.00"),"0.","") = "1.00",
                             "100",
                             SUBSTITUTE(FORMAT(Bar1, "0.00"),"0.","")
                             )
// Bar 1 % Label
VAR Bar1Label = IF(FormatBar1 = "", "", FormatBar1 & "%")

/* Format Bar 2 and Label 2 ----------------------------------------------------*/
// Bar 2 (If 1 Then make a 100%)
VAR FormatBar2  =  IF(
                             SUBSTITUTE(FORMAT(Bar2, "0.00"),"0.","") = "1.00",
                             "100",
                             SUBSTITUTE(FORMAT(Bar2, "0.00"),"0.","")
                               )

VAR Bar2Label = IF(FormatBar2 = "", "", FormatBar2 & "%")

/* SVG Settings ----------------------------------------------------------------*/

//Set SVG Canvas Size
VAR CanvasHeight = 20
VAR CanvasWidth = 200

// Set Bar Colors
VAR Bar1Color = "#006FCD"
VAR Bar2Color = "#0e7a0d"

//Set Bar Height
VAR BarHeight = 10

// Set Bar Y Position
VAR BarPositionY = 5

// Set Bar 1 and Bar 2 Start Points
VAR Bar1Start = 30 // Set the X axis starting point of the first bar
VAR Bar2Start = Bar1 * 100 + Bar1Start // Set the X axis of the second bar

//Set Label Y Position
VAR LabelPositionY = 15

//Set Label Font
VAR LabelFont = "Arial"

//Set Label Font Size
VAR LabelFontSize = 11

//Set Lable 1 and 2 Start Points
VAR Label1Start = 0
VAR Label2Start = FormatBar1 + FormatBar2 + Bar1Start + 5 // Add Starting point + Bar 1 + Bar 2 width + 5 padding

// Image code (this is needed so Power BI can recognize the SVG tag as an image).
VAR ImageCode = "data:image/svg+xml;utf8,"

/* Set the Final SVG Code with variables ---------------------------------------*/

VAR FinalCode =
ImageCode & "<svg height = '" & CanvasHeight &"' width='" & CanvasWidth &"' xmlns='http://www.w3.org/2000/svg'>
   <text x='" & Label1Start &"' y='" & LabelPositionY &"' fill='" & Bar1Color &"' font-family='" & LabelFont &"' font-size='" & LabelFontSize &"' >" & Bar1Label &"</text>

    <rect width='" & FormatBar1 &"' height='" & BarHeight &"' x='" & Bar1Start &"' y='" & BarPositionY &"' fill='" & Bar1Color &"' />

    <rect width='" & FormatBar2 &"' height='" & BarHeight &"' x='" & Bar2Start &"' y='" & BarPositionY &"' fill='" & Bar2Color &"' />

    <text x='" & Label2Start &"' y='" & LabelPositionY &"' fill='" & Bar2Color &"' font-family='" & LabelFont &"' font-size='" & LabelFontSize &"' >" & Bar2Label &"</text>
</svg> " RETURN FinalCode